

MySQL Workbench Status
Recently, I became curious about the various metrics and graphs displayed in the MySQL Workbench Server Status dashboard. To help myself (and others) understand them better, I summarized what each graph and indicator represents and how to interpret them. Below is a breakdown of the key sections based on what I see in the dashboard:
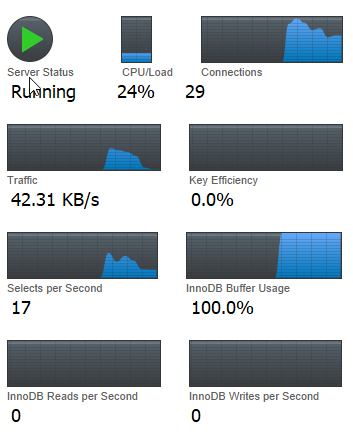
Server Status: Running
Easy to guess, this indicates that the MySQL server is currently active and functioning. If the status shows Stopped, then the server is not running and no connections or queries can be processed.
CPU/Load
It is also easy to guess, the CPU Load like when we open the task manager on the windows, it shows how much CPU power MySQL is using. For example, a value like 24% means MySQL is using 24% of the available CPU resources. If the CPU consistently on 80 – 100%, we have to start finding the root cause before bad thing happen.
Connection
This represents the number of active client connections to the server. Seeing a value like 29 connections means 29 clients, applications, or services are currently connected. If this number grows too close to the MySQL limit (max_connections), you may encounter the error “Too many connections.”
Traffic
This shows the data transfer rate, how fast MySQL is sending and receiving data.
Key Efficiency
This one makes me think, why the graph is completely empty, so let’s just discuss with AI. This metric represents the key buffer hit rate, which primarily applies to MyISAM tables. Because all tables are in InnoDB, then 0% is normal and not a problem
Select Per Second
This panel displays how many SELECT queries are executed every second. If you see 17 selects/sec, it means MySQL is currently handling moderate read activity. A sudden spike in this number may indicate heavy traffic or inefficient queries.
InnoDB Buffer Usage
This shows how much of the InnoDB buffer pool is being used. A value of 100% is actually normal. InnoDB is designed to use the entire allocated buffer pool to cache data efficiently. We will get a problem when the system begins using swap memory due to insufficient RAM.
InnoDB Reads per Second
This shows how many read operations are being executed from disk every second. A value of 0 often means all required data is already cached in the buffer pool, which is good for performance.
InnoDB Writes per Second
This metric shows how many write operations are happening each second. A value of 0 simply indicates that no write activity is occurring at that moment.
Understanding the metrics in MySQL Workbench’s not only helps you monitor your database health but also makes it easier to diagnose performance issues before they grow into bigger problems. By regularly observing these indicators, you can develop a stronger intuition about how your server behaves under different workloads and ensure your applications continue running smoothly. Thanks for reading …
